


Abstract
Hearing loss in older adults is suspected to play a role in social isolation, depression, disability, lower quality of life, and risk of dementia. Such suspected associations still need to be consolidated with additional research. With a particularly long follow-up, this study assessed the relationship between hearing status and four major adverse health events: death, dementia, depression, and disability.
Prospective community-based study of 3,777 participants aged ≥65 followed up for 25 years. At baseline, 1,289 reported hearing problems and 2,290 reported no trouble. The risk of occurrence of the negative outcomes, including death, dementia, depressive symptoms, disability in activities of daily living (ADL), and instrumental ADL (IADL), was assessed with Cox proportional hazards models.
Adjusting for numerous confounders, an increased risk of disability and dementia was found for participants reporting hearing problems. An increased risk of depression was found in men reporting hearing problems. In additional exploratory analyses, such associations were not found in those participants using hearing aids. Mortality was not associated with self-reported hearing loss.
Our study confirms the strong link between hearing status and the risk of disability, dementia, and depression. These results highlight the importance of assessing the consequences of treating hearing loss in elders in further studies.
With approximately 30 per cent of elders aged 65 and older having some degree of hearing loss, and 70 per cent to 90 per cent over the age of 85, hearing loss is the third most prevalent chronic health condition affecting older adults (1). A wide range of implications for health and general well-being have been reported, among which social isolation and depression (2,3), altered physical function (4), reduced activity participation (5), lower quality of life (6), falls (7), greater cognitive decline (8), or higher risk of dementia (9). Despite such suspected consequences, hearing loss in elderly people remains largely underdiagnosed and undertreated (10). Therefore, such suspected associations still need to be consolidated with additional research.
Scarce longitudinal data have looked at the impact of hearing-aid use with a special attention on quality of life. In the review of Chisolm and colleagues (11), the conclusion was that hearing-aid use was associated with positive effects on health-related quality of life and hearing disability measures. More recently, in a sample of 666 community-dwelling older adults with hearing impairment seen at baseline, and followed up 5 years later, Dawes and colleagues (12) found no difference in cognition, social engagement, or mental health in hearing-aid users compared with nonusers, whereas 11 years after baseline, hearing-aid users had lower score of hearing handicap and better physical health. With a longer follow-up and a larger sample, a previous study of our team showed that although hearing loss was associated with accelerated cognitive decline in older adults, a similar rate of cognitive decline was observed in hearing-aid users as that of elders with no hearing loss (13), suggesting a positive impact of hearing aids on long-term cognition. Regarding randomized controlled trials (RCTs), four studies are available, three of them reporting reductions in hearing handicap in the hearing-aid group (14–16) and one reporting no impact (17).
Therefore, beyond quality of life and hearing handicap, there is limited and inconsistent evidence for the impact of hearing aids. Yet, hearing loss management could be considered as one of the potential strategies of intervention to promote successful aging. Thus, assessing the impact of hearing loss with and without management on health outcomes is a matter of major importance to elderly individuals and the field of public health. Healthy aging embraces cognitive, physical, and emotional dimensions. Indeed, most definitions consider that preserved cognitive functioning, functional autonomy in daily life activities, and emotional well-being are the main features of successful aging (18). In that perspective, in addition to death, dementia, depression, and disability can be viewed as the cardinal markers of successful or pathological aging. Such conditions not only have devastating effects at individuals’ level, but they also are the main sources of burden for family caregivers and—at least three of them—generate heavy costs for our societies.
The present study was conducted within the PAQUID survey, a prospective population-based study involving 25 years of follow-up, and consisted in assessing the relationship between hearing status and the occurrence of four major adverse events: death, dementia, depression, and disability.
Methods
Study Population and Protocol
The PAQUID study is a French epidemiological study relying on a population-based sample of 3,777 community-dwelling individuals aged 65 or older. The study has received the approval of Ethics Committee of the Bordeaux University Hospital, and all participants gave their written informed consent to participate in this study. Volunteers were evaluated at home at the initial visit (T0) and at 1 (T1), 3 (T3), 5 (T5), 8 (T8), 10 (T10), 13 (T13), 15 (T15), 17 (T17), 20 (T20), 22 (T22), and 25 (T25) years. Each visit included a neuropsychological evaluation and a criteria checklist for dementia diagnosis completed by a trained psychologist. At each follow-up visit, tests and scales of cognitive performances, cognitive complaints, functional abilities, and depressive symptomatology were administered to participants. A short neuropsychological battery has been administered comprising Mini-Mental State Examination (19) providing a global assessment of cognitive functioning. Full details of the study have been described elsewhere (20). Table 1 displays the study participation all along the 25 years of follow-up.
Study Participation and Vital Status All Along the 25-Year Follow-up of the PAQUID Study (1988–2014; N = 3,588)
| Visit | Study wave | Seen | Not seen* | Died before visit (cumulative total) |
|---|---|---|---|---|
| 1 | Baseline | 3,588 | 0 | 0 |
| 2 | 1 y | 1,771 | 1,719† | 98 |
| 3 | 3 y | 2,224 | 957 | 407 |
| 4 | 5 y | 2,013 | 820 | 755 |
| 5 | 8 y | 1,526 | 914 | 1,148 |
| 6 | 10 y | 1,425 | 741 | 1,422 |
| 7 | 13 y | 1,016 | 644 | 1,928 |
| 8 | 15 y | 815 | 502 | 2,271 |
| 9 | 17 y | 672 | 350 | 2,566 |
| 10 | 20 y | 500 | 230 | 2,858 |
| 11 | 22 y | 360 | 171 | 3,057 |
| 12 | 25 y | 228 | 133 | 3,227 |
Notes: *Participants who refused to be interviewed at that wave and/or discontinued their participation for all subsequent waves.
†At 1-year follow-up, only the participants of Gironde were interviewed.
Hearing Status Measures
At baseline, a short questionnaire assessing self-perceived hearing problems has been administered. To the question “do you have hearing trouble?” the participant could respond as follows: (a) I do not have hearing trouble; (b) I have trouble following the conversation with two or more people talking at the same time or in a noisy background; and (c) I have major hearing trouble. Participants were also asked whether they used a hearing aid or not.
Death
At each follow-up, vital status was systematically recorded for all the participants. Data on vital status and date of death were collected from family, physicians, and civil state records.
Depressive Symptoms
Depressive symptomatology was assessed using the Center for Epidemiological Studies Depression Scale (CES-D) (21). Participants were considered as having depressive symptomatology when the score was equal to 23 or higher for women and 17 or higher for men.
Disability
Two domains of disability based on the concepts of basic activities of daily living (ADL) and instrumental ADL (IADL) were used as outcomes. Based on the Lawton–Brody scale (22), disability in IADL was assessed according to the ability of the participants to use a telephone, manage medication, manage money, use public or private transport, and do shopping, for both genders, and additionally, to do the laundry, do housework, and prepare meals for women.
Disability in ADL was assessed using five items of the Katz scale (23): bathing, dressing, toileting, transferring from bed to chair, and eating. Incontinence, which is an impairment rather than a disability (24), was not considered here.
A participant was considered as disabled if he or she could not perform at least one activity of the domain without a given level of assistance, as defined in the respective instruments (22, 23).
Dementia Diagnosis
The diagnosis of dementia relied on a three-step procedure. After the interview and neuropsychological evaluation, the psychologist completed a criteria checklist for dementia diagnosis. Individuals who met dementia criteria were seen by a neurologist or geriatrician who confirmed or rejected the diagnosis according to current standards. At final step, the diagnosis of dementia and its etiology was reviewed by an independent panel of specialized neurologists.
Study Sample
All 3,777 participants of the PAQUID cohort were eligible for this analysis, with the exception of those with a diagnosis of dementia at baseline visit (n = 102) and those who did not complete the questionnaire on hearing problems (n = 93). Of these, 3,588 had available data for the analyses on mortality and those on dementia. In addition, to study the occurrence of each outcome studied (disability in ADL, disability in ADL, and depression), we excluded the participants already having the condition at baseline. So, samples were as follows: 3,452 for the analyses on disability in ADL, 2,561 for the analyses on disability in IADL, and 3,119 for the analyses on depression. Figure 1 displays the flowchart of participants for each analysis.
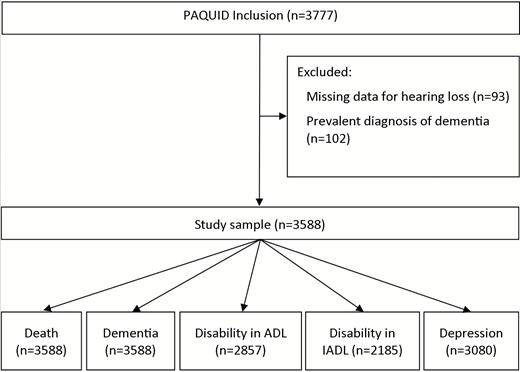
Flow of participants through study, PAQUID cohort.
Statistical Analysis
Baseline characteristics of participants were compared using chi-square tests, analyses of variance, and mean comparisons as appropriate.
The four outcome variables to be predicted were death, dementia, disability, and depressive symptoms. In a first model, the predictor variable was hearing loss: self-reported hearing loss and no self-reported hearing loss. In additional exploratory analyses, the group of participants reporting hearing loss was stratified according to hearing-aid use.
Analyses of the risk of occurrence of the outcome variables were performed using a Cox proportional hazards model (25). The number of years since the baseline was used as the basic time scale in the analysis. For each outcome, multivariate analyses controlled for age, gender, educational level (defined in two categories: no formal education and school certificate or higher), and the number of comorbidities (including hypertension, myocardial infarction, angor, diabetes, dyspnea, history of stroke, and smoking) were performed. Interactions with gender were tested to assess whether gender modulated the relationship between hearing status and each of the to-be-predicted outcomes. Analyses were performed using SAS (version 9.3), Proc Phreg (SAS Institute, Inc., Cary, NC).
Results
Participants
Mean age of the whole sample at baseline was 75.3 (SD = 6.8), 57.8 per cent were women. Table 2 displays the baseline characteristics of the three subgroups of participants. At baseline, 2,299 reported no hearing trouble, 1,113 reported hearing problems not using hearing aids (of whom 49.7% were women), and 176 reported hearing problems using hearing aids (of whom 44.9% were women). Significant differences between the three groups of participants were observed for all variables.
Characteristics of Study Sample, PAQUID Cohort, N = 3,588
| Characteristics | All (N = 3,588) | No hearing trouble reported (n = 2,299) | Self-reported hearing trouble with no hearing aids (n = 1,113) | Self-reported hearing trouble with hearing aids (n = 176) | p-Value |
|---|---|---|---|---|---|
| Age (y), mean (SD) | 75.3 (6.8) | 74.0 (6.2) | 77.2 (7.2) | 79.0 (7.6) | <.01* |
| Woman, n (%) | 2,075 (57.8) | 1,443 (62.8) | 553 (49.7) | 79 (44.9) | <.01† |
| Education, n (%) | |||||
| School certificate or higher | 2,344 (65.3) | 1,556 (67.7) | 659 (59.2) | 129 (73.3) | <.01† |
| MMSE score, mean (SD), MD = 85 | 25.8 (3.4) | 26.2 (3.2) | 25.2 (3.7) | 26.0 (2.8) | <.01* |
| Comorbidities, mean (SD) | 1.4 (1.0) | 1.4 (0.9) | 1.6 (1.0) | 1.5 (1.0) | <.01‡ |
| Hypertension, n (%) | 2,704 (75.4) | 1,725 (75.0) | 850 (76.4) | 129 (73.3) | .56† |
| Diabetes, n (%), MD = 1 | 316 (8.8) | 196 (8.5) | 99 (8.9) | 21 (11.9) | .31† |
| Myocardial infarction or Angor, n (%), MD = 4 | 765 (21.3) | 421 (18.3) | 297 (26.7) | 47 (26.7) | <.01† |
| Stroke, n (%), MD = 3 | 189 (5.3) | 101 (4.4) | 83 (7.5) | 5 (2.9) | <.01† |
| Dyspnea, n (%), MD = 24 | 870 (24.4) | 467 (20.5) | 360 (32.6) | 43 (24.6) | <.01† |
| Smoking, n (%), MD = 5 | 342 (9.6) | 230 (10.0) | 98 (8.8) | 14 (8.0) | .41† |
Notes: MMSE = Mini-Mental State Examination; MD = Missing data; SD = Standard deviation.
*ANOVA comparison of the three groups.
†p-value for chi-square test.
‡Kruskal–Wallis nonparametric test.
Self-reported Hearing Loss and Risk of Death, Depression, Disability, and Dementia
Table 3 displays the hazard ratios (HR) estimated by multivariate Cox models for death, depression, disability, and dementia for the group of participants with self-reported hearing problems compared with participants reporting no hearing problems. As may be seen, after adjustment for sociodemographic and health variables, an increased risk of dementia and of disability in ADL were found in elders with self-reported hearing problems. There was a statistical trend for disability in IADL. For mortality, dementia, and disability, there was no significant interaction with gender. However, a significant interaction with gender was found for depression (p = .03).
Estimated Hazard Ratios of Self-reported Hearing Loss at Baseline on the Risks of Death, Depression, Disability, and Dementia: PAQUID Study
| Events n (%) | HR* | 95% CI | p-Value | |
|---|---|---|---|---|
| Death (n = 3,588) | ||||
| No hearing trouble reported | 2,048 (88.1) | |||
| Self-reported hearing trouble | 1,179 (93.3) | 0.99 | 0.92–1.07 | .8118 |
| Depressive symptoms (n = 3,080) | ||||
| No hearing trouble reported | 326 (15.7) | |||
| Self-reported hearing trouble | 181 (18.1) | 1.17 | 0.97–1.42 | .1005 |
| Disability in ADL (n = 2,857) | ||||
| No hearing trouble reported | 552 (29.4) | |||
| Self-reported hearing trouble | 323 (33.1) | 1.23 | 1.07–1.42 | .0046 |
| Disability in IADL (n = 2,185) | ||||
| No hearing trouble reported | 994 (64.7) | |||
| Self-reported hearing trouble | 444 (68.5) | 1.11 | 0.99–1.24 | .0861 |
| Dementia (n = 3,588) | ||||
| No hearing trouble reported | 561 (24.1) | |||
| Self-reported hearing trouble | 315 (24.9) | 1.18 | 1.02–1.36 | .0238 |
Notes: ADL = Activities of daily living; CI = Confidence interval; HR = Hazard ratio; IADL = Instrumental activities of daily living.
*Adjusted for age, gender, education, comorbidities.
Stratified Analysis According to Hearing-Aid Use
Table 4 reports the results of additional exploratory models conducted after stratifying the group of participants reporting hearing loss according to hearing-aid use. No increased risk of mortality was found in elders with self-reported hearing problems whether they used hearing aids or not. Regarding depression, no increased risk was found for the group of participants reporting hearing problems (using or not using hearing aids) compared with the participants reporting no hearing problems. Due to significant interaction with gender, stratified analyses were conducted and showed that self-reported hearing problems with no hearing aids were associated with higher risk of depression in men (Table 5). Regarding disability, the model showed an increased risk of disability in ADL for the group of participants with self-reported hearing problems not using hearing aids. No increased risk was found for those with self-reported hearing problems using hearing aids compared with the participants reporting no hearing problems. Actually in this group, the HR was <1 (HR = 0.81). Similarly, for disability in IADL, the model showed an increased risk for the participants with self-reported hearing problems not using hearing aids but not for those using hearing aids. Finally, regarding dementia, the model showed an increased risk for the group of participants with self-reported hearing problems not using hearing aids. No increased risk was found for those with self-reported hearing problems using hearing aids compared with the group reporting no hearing problems. Actually in this group, the HR was <1 (HR = 0.86).
Estimated Hazard Ratios of Self-reported Hearing Loss at Baseline on the Risks of Death, Depression, Disability, and Dementia Stratified According to Hearing-Aid Use: PAQUID Study
| Events n (%) | HR* | 95% CI | p-Value | |
|---|---|---|---|---|
| Death (n = 3,588) | ||||
| No hearing trouble reported | 2,025 (88.1) | |||
| Self-reported hearing trouble with no hearing aids | 1,038 (93.3) | 0.99 | 0.92–1.07 | .81 |
| Self-reported hearing trouble with hearing aids | 164 (93.2) | 1.03 | 0.87–1.21 | .75 |
| Depressive symptoms (n = 3,080) | ||||
| No hearing trouble reported | 324 (15.8) | |||
| Self-reported hearing trouble with no hearing aids | 163 (18.6) | 1.18 | 0.97–1.44 | .09 |
| Self-reported hearing trouble with hearing aids | 20 (13.6) | 1.05 | 0.66–1.65 | .85 |
| Disability in ADL (n = 2,857) | ||||
| No hearing trouble reported | 547 (29.4) | |||
| Self-reported hearing trouble with no hearing aids | 301 (34.8) | 1.28 | 1.11–1.48 | <.01 |
| Self-reported hearing trouble with hearing aids | 27 (20.3) | 0.81 | 0.55–1.20 | .30 |
| Disability in IADL (n = 2,185) | ||||
| No hearing trouble reported | 979 (64.6) | |||
| Self-reported hearing trouble with no hearing aids | 395 (69.4) | 1.13 | 1.00–1.27 | .05 |
| Self-reported hearing trouble with hearing aids | 64 (64.0) | 1.09 | 0.84–1.41 | .53 |
| Dementia (n = 3,588) | ||||
| No hearing trouble reported | 556 (24.2) | |||
| Self-reported hearing trouble with no hearing aids | 291 (26.2) | 1.21 | 1.05–1.40 | .01 |
| Self-reported hearing trouble with hearing aids | 29 (16.5) | 0.86 | 0.59–1.26 | .45 |
Notes: ADL = Activities of daily living; CI = Confidence interval; HR = Hazard ratio; IADL = Instrumental activities of daily living.
*Adjusted for age, gender, education, and comorbidities.
Gender-Specific Model, Estimated Hazard Ratios of Hearing Status at Baseline on the Risk of Depression: PAQUID Study
| Events n (%) | HR* | 95% CI | p-Value | |
|---|---|---|---|---|
| Woman (n = 1,753) | ||||
| No hearing trouble | 219 (17.3) | |||
| Hearing trouble with no hearing aids | 71 (16.8) | 1.01 | 0.77–1.34 | .92 |
| Hearing trouble with hearing aids | 8 (12.5) | 0.89 | 0.44–1.82 | .76 |
| Men (n = 1,327) | ||||
| No hearing trouble | 105 (13.3) | |||
| Hearing trouble with no hearing aids | 92 (20.2) | 1.43 | 1.07–1.90 | .01 |
| Hearing trouble with hearing aids | 12 (14.5) | 1.21 | 0.66–2.22 | .54 |
Notes: CI = Confidence interval; HR = Hazard ratio.
*Adjusted for age, gender, educational level, and comorbidities.
Discussion
With a design involving 25 years of follow-up of a population-based cohort of elderly participants, our study evidenced a significant association between self-reported hearing problems and increased risk of ADL and IADL disability and dementia. It was also associated with increased risk of depression in men. Regarding mortality, similar risk of death all along the 25 years of study follow-up was found in participants with or without self-reported hearing problems.
Numerous studies had reported a negative association between hearing impairment and depression and social isolation (2, 3). Interestingly in our study, such a negative impact was particularly seen in men. This result could be linked to gender differences in audiometric shapes of presbyacusic individuals. Men seem to show more loss than women at frequencies above 1 kHz, whereas women show more loss below 1 kHz probably because different factors may be involved in age-related hearing loss phenomenon in males and females (eg noise exposure and microvascular disease) (26). With high frequency loss affecting speech comprehension, the potential impact in daily life may be different and repercussions on communication abilities more important in men. Some studies also reported an association with disability. However, they were either cross-sectional (27, 28) or involved a very short follow-up period (29). In addition to the long follow-up, our study has the advantage to measure disability in both ADL and IADL and yielded consistent results for the two domains of disability. Regarding dementia, few studies have reported an increased risk of developing dementia in older adults with hearing impairment (9, 30, 31). Therefore, along with prior findings, our results strongly reinforce the assumption that self-reported hearing problems in elders contribute to develop depression, disability, and dementia. Regarding mortality, the literature is mitigated. Some studies showed higher mortality (32), others reported no association (33), whereas others suggested an association with mortality mediated by factors such as cognitive impairment, disability, or subjective health (34). In our study, similar risk of mortality all along the 25 years of study follow-up was found in participants with or without self-reported hearing problems.
Interestingly, negative associations between self-reported hearing trouble and depression, disability, and dementia were not evidenced in older adults using hearing aids. In other words, elders with self-reported hearing problems using hearing aids presented similar risk of developing depression, disability, and dementia all along the 25 years of follow-up of the study as their counterparts reporting no hearing impairment. Such a result had never been reported.
Some longitudinal data have looked at the impact of hearing-aid use on health outcomes. These studies have reported positive impact on quality of life (11), handicap and better physical health (12), and cognitive decline (13). Scarce RCTs have looked at the impact of hearing-aid use on health. Three of them reported reductions in hearing handicap in the hearing-aid group (14–16) and one found no impact (17). As may be seen, limited information is available from longitudinal observational studies or RCTs regarding the effect of hearing aids on disability and mental health. Most of the studies to date have been limited to short-term outcomes associated with hearing-aid use. Yet, one would expect that the positive impact of hearing-aid use may only emerge after a longer time frame. Cognitive decline, disability, and dementia are slowly progressive phenomena that can only be captured over a time scale of several years. Some protective effects of hearing-aid use may therefore only be observable over a time scale of years or decades and may be missed by RCTs or short prospective observational studies.
One of the main strengths of our study is undoubtedly the exceptionally long follow-up of participants, making the PAQUID study one of the longest population-based study on aging, giving the opportunity to study the long-term effects of rehabilitative strategies requiring long exposure to entail reliable effects, which is probably the case for hearing loss management. Another strength is the population-based design, and the interviews that were conducted in participants’ homes, facilitating the participation of frailer older people. However, to be included in the study, participants were required to be able to communicate during the home interview. This criterion probably decreased the number of persons with severe hearing impairment. Moreover, multiple factors may affect whether an individual with hearing loss uses or not hearing aids such as income, health awareness, or personality traits. Even though numerous potentially confounding variables have been controlled for in our study, obviously we cannot exclude residual effects of uncontrolled variables. In particular, the question of what differs in people who use hearing aids compared with those who do not is a critical but complex issue. Further studies should try to better characterize what makes people with hearing loss seek for care and whether such characteristics can explain at least partially the potential benefits of hearing-aid use. As recommended by previous studies having validated the CESD-scale in French elderly population (35), we used different cut-points for men and women. This could have potential implications on the interpretation of results related to depression outcome. Another limitation of our study relies on the self-reported measure of hearing impairment. Hearing status and hearing-aid use could have changed all along the follow-up period. In addition, no audiometric measure is available. Our measure simply consisted in collecting self-perceived hearing difficulty which is far less precise than an audiometric measure. Nonetheless, numerous studies have shown that self-reported hearing loss is highly correlated to audiometric measures of hearing loss in older adults (36–41). In addition, from a practical point of view, in a perspective of screening for hearing loss in elderly persons and its potential consequences, such an easy-to-collect measure may be useful.
Our study shows that self-reported hearing trouble is associated with increased risk of disability, dementia, and also depression in men. Such increased risks were not evidenced in those older adults using hearing aids. Because hearing impairment in older adults is both highly prevalent and treatable, these results highlight the importance of formally assessing the consequences of treating hearing loss in elders in further RCT studies.
Funding
This work was supported by ARMA (Bordeaux), Caisse Nationale d’Assurance Maladie des Travailleurs Salariés (CNAMTS), Conseil Général de la Dordogne, Conseil Général de la Gironde, Conseil Régional d’Aquitaine, Fondation de France, France Alzheimer (Paris), GIS Longévité, Institut National de la Santé et de la Recherche Médicale (INSERM), Mutuelle Générale de l’Education Nationale (MGEN), Mutualité Sociale Agricole (MSA), NOVARTIS Pharma (France), and SCORInsurance (France). The funders had no role in study design, data collection and analysis, decision to publish, or preparation of the manuscript.
Aknowledgments
H.A. interpreted the data and wrote the manuscript. H.A. designed and supervised the study. C.M. conducted the statistical analysis. J.F.D. is the PI of the PAQUID study. C.O., C.M., L.R., and J.F.D. provided critical revisions of the manuscript.

